How Does the Affordable Care Act Affect People Who Buy Health Insurance in the Individual Market?
12.10.2013
New data released yesterday by the Obama administration estimates the number of people whose health insurance was canceled and who have yet to sign up for new coverage in the marketplace to be less than half a million, according to Politico. That’s a far cry from earlier projections that millions of people would lose coverage on January 1. Politico reports that senior administration officials attributed these shrinking estimates to the grandfathering of many policies and automatic renewals by health insurers, a claim echoed by Families USA in our original report below, and the reason we characterized our methodology as conservative.
And the administration also announced that people who have had their substandard plans canceled will now be considered part of the “hardship” group that can buy less costly catastrophic plans from the health insurance marketplace. These plans are designed to cover a major catastrophic health event and typically have high deductibles and limited coverage. But once the deductible is met, these plans do cover the essential health benefits and preventive care that the Affordable Care Act requires, so they may be a viable option for consumers in search of limited, low-cost health coverage. Prior to today’s announcement, catastrophic plans were available only to a smaller pool of consumers (young adults under the age of 30 or those 30 and older who could demonstrate financial hardship).
Introduction
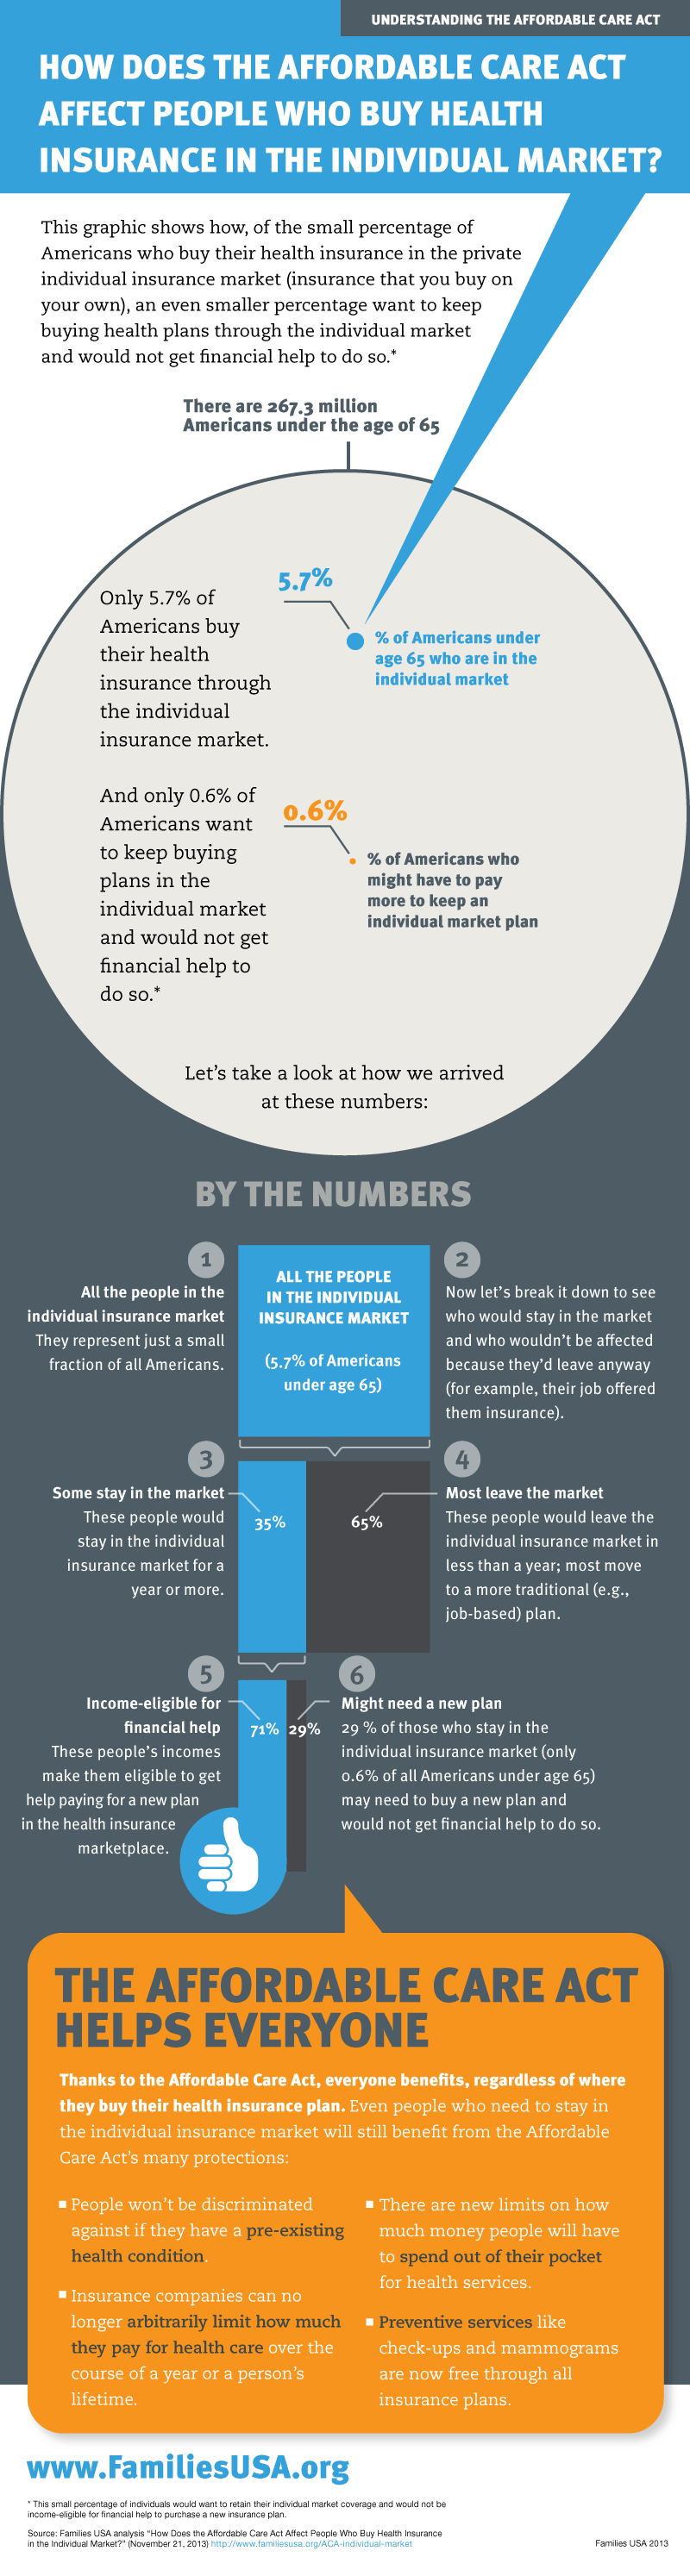
Public debate around the Affordable Care Act (ACA) has focused recently on recipients of private, individual (non-group) insurance whose health plans are being terminated and who fear they may need to pay more for new coverage. Families USA’s new report and accompanying infographic offers a new perspective on this issue: The individual market covers 5.7 percent of the non-elderly population—a small slice of all insured Americans. Our analysis shows how, under the ACA, only 0.6 percent of Americans under age 65 will be at risk of losing their current individual market plan and will not be income-eligible for financial assistance that will make their new insurance plan more affordable. Even among this 0.6 percent, some have insurers who will not or cannot cancel their plans. Others will decide that they are better off with higher-value plans in the new insurance marketplaces.
Our analysis explains how the overwhelming majority of people in the individual market will obtain more affordable coverage under the health care law because they will be income-eligible for financial assistance to help pay for comprehensive insurance at a lower cost. Individuals with household incomes that do not exceed four times the federal poverty level ($94,200 for a family of four in 2013)1 are income-eligible for either premium tax credit subsidies to buy coverage in the new health insurance marketplaces2 or Medicaid, which charges no premiums for most enrollees.3
Our analysis also estimates the number of consumers who will become eligible for new financial help that will make premiums more affordable, and it looks at the percentage of people in the individual market who stay in that market for more than one year, a portion of whom historically may have had an offer to keep the same plan in this market.
Key Findings
Only 5.7 percent of non-elderly Americans are in the Individual Market
- Out of 267 million Americans under age 65, just 15.2 million, or 5.7 percent, receive their coverage through the private, individual (non-group) market.4 (See Table 1)
Most People with Plans in the Individual Market Will Qualify for Financial Help in Purchasing New, and Better, Insurance
- Nationally, 71 percent of people in the individual market under age 65 have incomes at or below 400 percent of poverty. Under the Affordable Care Act, these people are income-eligible for financial help to purchase an insurance plan, either through new premium tax credit subsidies or through expanded Medicaid. (See Table 2) Consumers with incomes that are too high for financial help (above 400 percent of poverty) represent the balance of those in the individual market. (See Table 3)
Research Shows that Most Consumers Would Have Left the Individual Market in Less Than a Year, Regardless of the ACA
- According to peer-reviewed research, the average duration of individual-market coverage before the Affordable Care Act was very short. Its median duration was eight months, with individual plans often bridging periods of job-based coverage. Altogether, 64.5 percent of consumers with individual market insurance kept that insurance for a year or less—a result not affected by income.5
A Fraction of Americans are at Risk of a Potentially Harmful Termination of Ongoing Individual Market Coverage
- Approximately 29 percent of the individually insured have incomes above 400 percent of poverty and will not qualify for financial help with buying new coverage.
- Among that 29 percent, historically 35.5 percent–just 0.6 percent of all non-elderly Americans–retain ongoing individual coverage for more than a year. (See Table 4)
These are the only people who can lose the individual coverage they otherwise would have retained and who are not income-eligible for premium tax credit subsidies or Medicaid.
Discussion
This analysis focuses on non-elderly people with private, individual health insurance who will be better off thanks to the Affordable Care Act (ACA). For many, their health coverage will be upgraded due to the elimination of annual caps in health plan payouts, coverage of prescription drugs, and protections from high out-of-pocket costs.
More specifically, this report provides data reflecting the fact that almost three-quarters (71 percent) of those with such private, individual coverage will become income-eligible for robust premium tax credit subsidies or through the expansion of Medicaid.
This analysis also focuses on a narrow question: Among all Americans with health insurance, how many could potentially be harmed under the Affordable Care Act because:
- without the law, they would have retained individual market health insurance on an ongoing basis, so having their coverage end quickly would represent a change; and
- their incomes are too high to qualify for financial assistance that would make a new insurance plan more affordable.
A Conservative Methodology—The Number of People Affected Could Be Even Smaller
The group of people who would retain individual market coverage and not be income-eligible for financial help to purchase new plans turns out to be quite small, making up just 0.6 percent of all non-elderly U.S. residents. This estimate is conservative in three ways.
First, the study finding that 35.5 percent of individual market participants remain in the individual market for more than 12 months does not look at how many people remain in this market and keep the same plan. If someone changed from one individual market plan to another, either voluntarily or otherwise, that did not count as a coverage disruption under the study’s methodology. If such changes had been counted, the duration of time a person kept the same specific individual market plan would have been even a smaller percentage, and we would have developed a lower resulting estimate of the number of people potentially subject to paying for a new plan without financial assistance.
Second, some of the 35.5 percent of people who would have stayed in the individual market for more than one year are in plans that are “grandfathered” under the Affordable Care Act and would not actually be subject to termination for being substandard. If a consumer’s current plan has been in effect since March 23, 2010 (the date the ACA was signed into law), the plan is indefinitely grandfathered. It can continue as long as the insurer chooses to offer it.
Third, many of the 0.6 percent of Americans who have incomes too high for financial help and, without the ACA, would have kept their individual insurance for more than a year would prefer new coverage options, even without subsidies. A recent survey found that 45 percent of people with individual coverage described their insurance as “fair” or “poor,” compared to 18 percent or less for ever other form of coverage, including Medicaid.”6
And now, President Obama has amended the implementation of the ACA so that, if states allow it, an insurer can renew its current policy up until October 2014 without becoming subject to the health law’s new requirements.
Most Consumers Will Receive Robust Financial Assistance in Buying New Plans in the Health Insurance Marketplace
A recent analysis by the Kaiser Family Foundation concluded that, among individual market enrollees who will qualify for premium tax credit subsidies, the average tax credit will be $5,548 per family, which would cut premiums by 66 percent.7 At the lowest income levels, Medicaid will offer coverage with no premiums, with comprehensive benefits, charging copayments that are no more than nominal.8
Even in the highest income ranges of tax credit subsidy eligibility where tax credits are the smallest, these tax credit subsidies would still be large enough to greatly improve the affordability of individual insurance. The Congressional Budget Office projects that tax credits will pay an average of 15 percent of premiums for single coverage and 35 percent for family coverage when incomes are between 350 and 400 percent of poverty; tax credits cover 25 and 44 percent of premiums, respectively, when incomes fall to between 300 and 350 percent of poverty. Higher levels of assistance are available for people with lower incomes who need more help.
The Affordable Care Act Helps Protect All Consumers from Substandard Health Plans
There are good reasons why many individual market plans are being withdrawn from circulation. The individual market has historically offered plans that do not provide good coverage and that offer low value for premium dollars. Prior to passage of the Affordable Care Act, many plans established annual and/or lifetime limits for the coverage they provided, which left people who experienced major illnesses or accidents without financial protection–limitations that the new law eliminates. Many essential health care services were not covered in individual market “barebones plans.” The ACA’s reforms also help those whose health problems resulted in coverage denials, benefit exclusions, and unaffordable prices in the individual market.
Conclusion
Historically, two-thirds of individuals in the private, individual (non-group) market did not purchase insurance that lasted more than 12 months. The individual market before the Affordable Care Act was a transitory source of insurance and the “wild wild west” of health insurance marketplaces, with high out-of-pocket costs and few consumer protections. In this market, many plans left consumers with high unpaid medical bills, especially consumers who developed serious or chronic health problems. For most consumers who bought individual market coverage, it was their only health insurance option because they did not have an offer of affordable job-based coverage and their income was too high to qualify for Medicaid.
The ACA provides a new, consumer-friendly insurance marketplace with premium tax credit subsidies that will make insurance much more affordable, and it provides federal dollars for states to expand Medicaid.
In fact, under the ACA, only 0.6 percent of Americans under age 65 will be at risk of losing their current individual market plan and will not be income-eligible for financial assistance that will make their new insurance plan more affordable. Even among this 0.6 percent, some have insurers who will not or cannot cancel their plans. Others will decide that they are better off with higher-value plans in the new insurance marketplaces.
Like any other major piece of domestic legislation, the Affordable Care Act faces challenges. As the debate over the health law continues to evolve, it is important to keep those challenges in proper perspective.
About This Analysis: We use analyses of Current Population Survey (CPS) data, conducted by the Urban Institute, the Kaiser Commission on Medicaid and the Uninsured18, and the State Health Access Data Assistance Center19 to estimate the number and income distribution of recipients of individual coverage, both nationally and in each state. Using peer-reviewed research investigating market conditions that preceded the Affordable Care Act, we calculated the proportion of individually insured consumers who would have likely retained their current individual market plan without the health reform law. We then determined, among all Americans and residents of each state, the proportion who are not eligible for financial assistance under the ACA and who would remain insured through the individual market for more than a year.
Table 1:
People under age 65 with individual coverage, by state, 2010-2011
| State | All residents (thousands) |
Residents with individual coverage | |
| Number (thousands) | Percentage of all residents | ||
| Alabama | 4,087 | 217 | 5.3% |
| Alaska | 634 | 21 | 3.3% |
| Arizona | 5,668 | 283 | 5.0% |
| Arkansas | 2,445 | 117 | 4.8% |
| California | 33,029 | 2,213 | 6.7% |
| Colorado | 4,406 | 397 | 9.0% |
| Connecticut | 3,043 | 158 | 5.2% |
| Delaware | 762 | 35 | 4.6% |
| District of Columbia | 535 | 40 | 7.5% |
| Florida | 15,511 | 915 | 5.9% |
| Georgia | 8,627 | 466 | 5.4% |
| Hawaii | 1,112 | 47 | 4.2% |
| Idaho | 1,352 | 124 | 9.2% |
| Illinois | 11,100 | 588 | 5.3% |
| Indiana | 5,478 | 192 | 3.5% |
| Iowa | 2,617 | 186 | 7.1% |
| Kansas | 2,372 | 149 | 6.3% |
| Kentucky | 3,726 | 171 | 4.6% |
| Louisiana | 3,875 | 163 | 4.2% |
| Maine | 1,101 | 56 | 5.1% |
| Maryland | 5,058 | 273 | 5.4% |
| Massachusetts | 5,584 | 324 | 5.8% |
| Michigan | 8,352 | 476 | 5.7% |
| Minnesota | 4,543 | 263 | 5.8% |
| Mississippi | 2,531 | 137 | 5.4% |
| Missouri | 5,089 | 346 | 6.8% |
| Montana | 810 | 82 | 10.1% |
| Nebraska | 1,578 | 139 | 8.8% |
| Nevada | 2,348 | 141 | 6.0% |
| New Hampshire | 1,119 | 69 | 6.2% |
| New Jersey | 7,514 | 361 | 4.8% |
| New Mexico | 1,724 | 84 | 4.9% |
| New York | 16,651 | 766 | 4.6% |
| North Carolina | 8,130 | 407 | 5.0% |
| North Dakota | 571 | 62 | 10.8% |
| Ohio | 9,733 | 506 | 5.2% |
| Oklahoma | 3,189 | 156 | 4.9% |
| Oregon | 3,267 | 242 | 7.4% |
| Pennsylvania | 10,595 | 678 | 6.4% |
| Rhode Island | 880 | 44 | 5.0% |
| South Carolina | 3,927 | 188 | 4.8% |
| South Dakota | 692 | 62 | 8.9% |
| Tennessee | 5,468 | 323 | 5.9% |
| Texas | 22,692 | 953 | 4.2% |
| Utah | 2,499 | 157 | 6.3% |
| Vermont | 532 | 30 | 5.6% |
| Virginia | 6,836 | 403 | 5.9% |
| Washington | 5,837 | 356 | 6.1% |
| West Virginia | 1,569 | 27 | 1.7% |
| Wisconsin | 4,829 | 314 | 6.5% |
| Wyoming | 491 | 28 | 5.7% |
| U.S. Total | 267,321 | 15,185 | 5.7% |
Source: Urban Institute/KCMU 2012. Note: U.S. totals are for 2011.
Table 2:
People under age 65 with individual coverage and income at or below 400 percent of poverty, by state, 2010-2011
| State | All residents with individual coverage (thousands) |
Residents with individual coverage & income at or below 400 percent of poverty | |
| Number (thousands) | Percentage of all residents with individual coverage | ||
| Alabama | 217 | 163 | 75% |
| Alaska | 21 | – | 0% |
| Arizona | 283 | 210 | 74% |
| Arkansas | 117 | 91 | 77% |
| California | 2,213 | 1,506 | 68% |
| Colorado | 397 | 261 | 66% |
| Connecticut | 158 | 107 | 68% |
| Delaware | 35 | 24 | 67% |
| District of Columbia | 40 | 25 | 61% |
| Florida | 915 | 606 | 66% |
| Georgia | 466 | 330 | 71% |
| Hawaii | 47 | 36 | 78% |
| Idaho | 124 | 102 | 82% |
| Illinois | 588 | 390 | 66% |
| Indiana | 192 | 134 | 70% |
| Iowa | 186 | 128 | 69% |
| Kansas | 149 | 112 | 75% |
| Kentucky | 171 | 127 | 74% |
| Louisiana | 163 | 83 | 51% |
| Maine | 56 | 40 | 71% |
| Maryland | 273 | 192 | 70% |
| Massachusetts | 324 | 233 | 72% |
| Michigan | 476 | 370 | 78% |
| Minnesota | 263 | 181 | 69% |
| Mississippi | 137 | 89 | 65% |
| Missouri | 346 | 252 | 73% |
| Montana | 82 | 64 | 78% |
| Nebraska | 139 | 95 | 69% |
| Nevada | 141 | 95 | 67% |
| New Hampshire | 69 | 43 | 62% |
| New Jersey | 361 | 241 | 67% |
| New Mexico | 84 | 64 | 76% |
| New York | 766 | 565 | 74% |
| North Carolina | 407 | 267 | 66% |
| North Dakota | 62 | 41 | 66% |
| Ohio | 506 | 379 | 75% |
| Oklahoma | 156 | 112 | 72% |
| Oregon | 242 | 183 | 76% |
| Pennsylvania | 678 | 497 | 73% |
| Rhode Island | 44 | 28 | 64% |
| South Carolina | 188 | 157 | 83% |
| South Dakota | 62 | 46 | 75% |
| Tennessee | 323 | 237 | 74% |
| Texas | 953 | 629 | 66% |
| Utah | 157 | 133 | 84% |
| Vermont | 30 | 19 | 64% |
| Virginia | 403 | 320 | 79% |
| Washington | 356 | 243 | 68% |
| West Virginia | 27 | 21 | 79% |
| Wisconsin | 314 | 231 | 73% |
| Wyoming | 28 | 20 | 70% |
| U.S. Total | 15,185 | 10,829 | 71% |
Source: Urban Institute/KCMU 2012. Note: U.S. totals are for 2011.
Table 3:
People under age 65 with income over 400 percent of poverty and individual coverage that is retained for more than a year, by state, 2010-2011
| State | All residents (thousands) |
Among all residents the percentage with: | ||
| Individual coverage | Income > 400% FPL and individual coverage | Income > 400% FPL and individual coverage that is retained for more than a year | ||
| Alabama | 4,087 | 5.3% | 1.3% | 0.5% |
| Alaska | 634 | 3.3% | 3.3% | 1.2% |
| Arizona | 5,668 | 5.0% | 1.3% | 0.5% |
| Arkansas | 2,445 | 4.8% | 1.1% | 0.4% |
| California | 33,029 | 6.7% | 2.1% | 0.8% |
| Colorado | 4,406 | 9.0% | 3.1% | 1.1% |
| Connecticut | 3,043 | 5.2% | 1.7% | 0.6% |
| Delaware | 762 | 4.6% | 1.5% | 0.5% |
| District of Columbia | 535 | 7.5% | 2.9% | 1.0% |
| Florida | 15,511 | 5.9% | 2.0% | 0.7% |
| Georgia | 8,627 | 5.4% | 1.6% | 0.6% |
| Hawaii | 1,112 | 4.2% | 0.9% | 0.3% |
| Idaho | 1,352 | 9.2% | 1.7% | 0.6% |
| Illinois | 11,100 | 5.3% | 1.8% | 0.6% |
| Indiana | 5,478 | 3.5% | 1.1% | 0.4% |
| Iowa | 2,617 | 7.1% | 2.2% | 0.8% |
| Kansas | 2,372 | 6.3% | 1.6% | 0.6% |
| Kentucky | 3,726 | 4.6% | 1.2% | 0.4% |
| Louisiana | 3,875 | 4.2% | 2.1% | 0.7% |
| Maine | 1,101 | 5.1% | 1.5% | 0.5% |
| Maryland | 5,058 | 5.4% | 1.6% | 0.6% |
| Massachusetts | 5,584 | 5.8% | 1.6% | 0.6% |
| Michigan | 8,352 | 5.7% | 1.3% | 0.5% |
| Minnesota | 4,543 | 5.8% | 1.8% | 0.6% |
| Mississippi | 2,531 | 5.4% | 1.9% | 0.7% |
| Missouri | 5,089 | 6.8% | 1.8% | 0.7% |
| Montana | 810 | 10.1% | 2.2% | 0.8% |
| Nebraska | 1,578 | 8.8% | 2.8% | 1.0% |
| Nevada | 2,348 | 6.0% | 2.0% | 0.7% |
| New Hampshire | 1,119 | 6.2% | 2.3% | 0.8% |
| New Jersey | 7,514 | 4.8% | 1.6% | 0.6% |
| New Mexico | 1,724 | 4.9% | 1.2% | 0.4% |
| New York | 16,651 | 4.6% | 1.2% | 0.4% |
| North Carolina | 8,130 | 5.0% | 1.7% | 0.6% |
| North Dakota | 571 | 10.8% | 3.7% | 1.3% |
| Ohio | 9,733 | 5.2% | 1.3% | 0.5% |
| Oklahoma | 3,189 | 4.9% | 1.4% | 0.5% |
| Oregon | 3,267 | 7.4% | 1.8% | 0.6% |
| Pennsylvania | 10,595 | 6.4% | 1.7% | 0.6% |
| Rhode Island | 880 | 5.0% | 1.8% | 0.6% |
| South Carolina | 3,927 | 4.8% | 0.8% | 0.3% |
| South Dakota | 692 | 8.9% | 2.2% | 0.8% |
| Tennessee | 5,468 | 5.9% | 1.6% | 0.6% |
| Texas | 22,692 | 4.2% | 1.4% | 0.5% |
| Utah | 2,499 | 6.3% | 1.0% | 0.4% |
| Vermont | 532 | 5.6% | 2.0% | 0.7% |
| Virginia | 6,836 | 5.9% | 1.2% | 0.4% |
| Washington | 5,837 | 6.1% | 1.9% | 0.7% |
| West Virginia | 1,569 | 1.7% | 0.4% | 0.1% |
| Wisconsin | 4,829 | 6.5% | 1.7% | 0.6% |
| Wyoming | 491 | 5.7% | 1.7% | 0.6% |
| U.S. Total | 267,321 | 5.7% | 1.7% | 0.6% |
Sources: Urban Institute/Kaiser Commission on Medicaid and the Uninsured (KCMU) 2012; Ziller, et al. 2004.
Notes: (1) To determine the proportion of individually insured residents above 400 percent of poverty who retain coverage for more than a year, we applied the findings of Ziller et al. that, regardless of income, 64.5% of individual coverage lasts for 12 months or less. (2) U.S. totals are for 2011.
Table 4:
Among U.S. residents under age 65, the percentage who are at risk of losing ongoing individual coverage under the Affordable Care Act without qualifying for subsidies, 2011
| The percentage of U.S. residents with individual insurance | Among people with individual insurance, the percentage with incomes above 400 percent of poverty | Among people with individual insurance above 400 percent of poverty, the percentage who retain ongoing coverage for more than a year | The percentage of U.S. residents whose incomes exceed 400 percent of poverty and who have individual coverage they retain for more than a year |
| (A) | (B) | (C) | (A x B x C) |
| 5.7% | 29.1% | 35.5% | 0.6% |
Sources: Urban Institute/Kaiser Commission on Medicaid and the Uninsured (KCMU) 2012; Ziller, et al. 2004
Methodology
Our estimates of the number of residents under age 65, by state and nationally, their income, and their health coverage status were based on the analysis of Current Population Survey (CPS) data for 2010 and 2011 conducted by the Urban Institute and the Kaiser Commission on Medicaid and the Uninsured.20 For our analysis, we assumed that people with incomes below 400 percent of the federal poverty level would be income-eligible for premium tax credit subsidies or Medicaid. We assumed people who purchase coverage in the individual market are not disqualified from premium tax credits because they are offered employer-sponsored insurance that meets the Affordable Care Act’s requirements for affordability and minimum value. We did not attempt to determine how many people who are income-eligible for premium tax credit subsidies may not receive the financial assistance because the silver benchmark plan premium in the insurance marketplace in their state is so low that individuals already meet the income protection threshold of the subsidies.
According to CPS data, U.S. citizens make up 94 percent of individual market participants21, and we were unable to determine or impute the immigration status of the remainder, therefore assuming that they would not be disqualified on that basis.
We did not reduce the estimated number of people potentially qualifying for financial help under the ACA based on state decisions not to expand Medicaid eligibility. We made this assumption because it is those states’ choices, rather than the structure of the ACA, that is responsible for any of these adults’ lack of access to subsidized coverage that is substantially more affordable than their prior individual insurance.
To test the impact of this assumption on our findings, we estimated the number of adults with individual coverage who live in states that, as of October 22, 2013, had not chosen to expand Medicaid.22 Using the State Health Access Data Assistance Center (SHADAC)23 to ascertain the number of adults in these states with incomes at or below 138 percent of poverty, and modifying the results to compensate for differences between SHADAC’s adjustments to CPS data and those used by the Urban Institute, we found that 10.9 percent of all individually insured consumers are adults with incomes below 138 percent of poverty who live in states that have not decided to expand Medicaid eligibility. Some of them will qualify for marketplace subsidies, since in states that do not expand Medicaid, adults qualify for marketplace subsidies with incomes as low as 100 percent of poverty. Others will qualify for Medicaid under pre-existing eligibility categories, such as for parents with incomes below specified levels, which vary by state. However, even if none of these adults received either marketplace subsidies or Medicaid, 60.1 percent of all individually insured consumers would still qualify for marketplace subsidies or Medicaid, and only 0.8 percent of all U.S. residents would be at risk of losing ongoing individual coverage without qualifying for assistance that will make their new insurance more affordable than their prior coverage.
Finally, to determine the proportion of people with individual coverage who, without the ACA, would have retained that coverage for more than a year, we relied on research by Ziller and colleagues, which found that, for 65.5 percent of consumers purchasing individual coverage in 1996-2000, such coverage lasted no longer than 12 months. Multivariate analyses concluded that income had no statistically significant impact on the duration of coverage.
Endnotes
1Office of the Assistant Secretary of Planning and Evaluation, 2013 Federal Poverty Guidelines (Washington: Department of Health and Human Services, January 24, 2013).
2The amount of the premium tax credit that people will be eligible to receive depends on their income and the premium costs for their age in the new marketplaces.
3In states that have not yet chosen to expand Medicaid, low-income people with family incomes below the federal poverty level but higher than existing state Medicaid income eligibility standards will be unable to secure new health coverage through the ACA. Since very few people with incomes below the poverty level have been able to afford private individual insurance premiums, this exclusion from the new coverage has only a small impact on the percentage of people with individual market coverage who will become eligible for premium tax credits or Medicaid. See the Methodology for details.
4Erika C. Ziller, Andrew F. Coburn, Timothy D. McBride, and Courtney Andrews, “Patterns of Individual Health Insurance Coverage, 1996-2000,” Health Affairs 23, no.6 (2004): 210-221.
5Ibid.
6Danielle Young, Abdullah Hammoud, Marianne Udow-Phillips, Melissa Riba, and Phillip Stadler. “Satisfaction with Health Care Coverage: Cover Michigan Survey 2013.” (Ann Arbor, MI: Center for Healthcare Research & Transformation, July 2013)
7Larry Levitt, Gary Claxton, and Anthony Damico. Quantifying Tax Credits for People Now Buying Insurance on Their Own (Palo Alto, CA: Kaiser Family Foundation, August 2013). The estimate in the text shows the average percentage that tax credits would pay for silver-level coverage, with an actuarial value of 70 percent. For “bronze” plans that have an actuarial value of 60 percent, such credits would cover 77 percent of premiums, according to Levitt and colleagues.
8For a discussion of the states that have chosen not to expand Medicaid eligibility as originally envisioned in the Affordable Care Act, see the Methodology.
9The estimate in the text concerns the actuarial value of coverage—that is, the percentage of health care costs the plan would pay, within covered benefit categories, for average consumers. Jon R. Gabel, Ryan Lore, Roland D. McDevitt, Jeremy D. Pickreign, Heidi Whitmore, Michael Slover, and Ethan Levy-Forsythe, “More than Half of Individual Health Plans Offer Coverage that Falls Short of What Can Be Sold through Exchanges As of 2014,” Health Affairs 31, no.6 (2012): 1,339-1,348.
10Thomas D. Musco, and Benjamin D. Sommers, Under the Affordable Care Act, 105 Million Americans No Longer Face Lifetime Limits on Health Benefits (Washington: Assistant Secretary for Planning and Evaluation, U.S. Department of Health and Human Services, April 25, 2012).
11Gabel et al., op cit.
12Assistant Secretary for Planning and Evaluation, U.S. Department of Health and Human Services, At Risk: Pre-Existing Conditions Could Affect 1 in 2 Americans: 129 Million People Could Be Denied Affordable Coverage without Health Reform (Washington: HHS, undated).
13http://www.cbo.gov/sites/default/files/cbofiles/ftpdocs/99xx/doc9924/chapter3.7.1.shtml.
14Cynthia Cox, Gary Claxton, and Larry Levitt, Beyond Rebates: How Much Are Consumers Saving from the ACA’s Medical Loss Ratio Provision? (Palo Alto, CA: Kaiser Family Foundation, June 6, 2013), available online at http://kff.org/health-reform/perspective/beyond-rebates-how-much-are-consumers-saving-from-the-acas-medical-loss-ratio-provision/.
15Assistant Secretary for Planning and Evaluation, U.S. Department of Health and Human Services, Essential Health Benefits: Individual Market Coverage (Washington: HHS, December 16, 2011).
16The analysis referenced in the text is based on a survey of individual coverage offered through ehealthinsurance.com. Brigette Courtot and Julia Kaye, Still Nowhere to Turn: Insurance Companies Treat Women Like a Pre-Existing Condition (Washington: National Women’s Law Center, 2009).
17Ibid.
18Kaiser Commission on Medicaid and the Uninsured and the Urban Institute, “Supplemental Data Tables,” The Uninsured: A Primer (Washington: Kaiser Family Foundation, October 2012).
19http://www.shadac.org/content/create-tables.
20Kaiser Commission on Medicaid and the Uninsured and the Urban Institute, op. cit.
21This estimate was developed using CPS Table Creator, available online at http://www.census.gov/cps/data/cpstablecreator.html, analyzing national-level data for 2012.
22For a list of such states, we relied on the tabulation compiled by the Kaiser Commission on Medicaid and the Uninsured, available online at http://kff.org/health-reform/state-indicator/state-activity-around-expanding-medicaid-under-the-affordable-care-act/.
23http://www.shadac.org/content/create-tables.